PEATE - Perl Event-related Average Timecourse Extraction
Cocoa Version
[click here for Tk version]Current version 3.01, October, 2013: (Full version history)
The Cocoa version of Peate provides a Mac OS X wrapper for the handy perl script Peate. In fact, you can use it like any old Mac application and you may never know that you're actually running a perl script. Ok, well now that you've read this you know.
It is recommended that you use Peate with Mac OS X Tiger, v10.4 or higher. Peate will work on OSX 10.3, but some of the functionality is limited (e.g. dragging and dropping of folders).
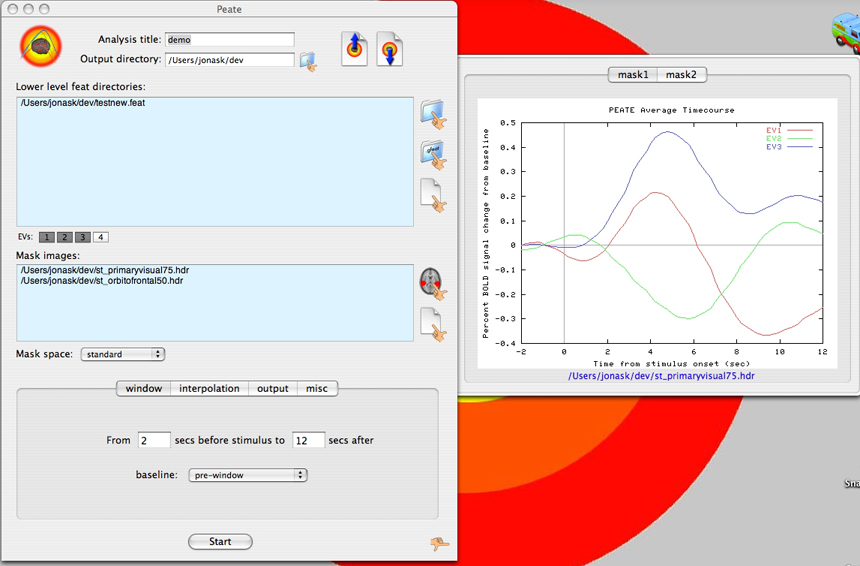
Screenshots
Download & Installation
First, download the disk image file: Peate3.dmg
Once the disk image is mounted, simply drag Peate to your Applications folder. That's it!
Using Peate
Initial setup
When you open Peate for the first time, you must tell it where your FSL directory is located and provide a default save location. The FSL directory you need to specify is the top level FSL directory that contains the bin folder. This is the one that you should have set as $FSLDIRECTORY in your shell.
The default save location is the folder peate will save output files to by default, and this setting can be overridden for each analysis.
Creating a configuration
1) The first thing to do is to enter a title for your analysis, and change the output directory if you want the files saved somewhere other than the default location.
2) Enter your lower level feat directories into the feat directories window. There are several ways to do this. If you click on the folder icon to the right of the feat directories window (![]() ) you can navigate to where your feat directories are and select them. If you have done a higher level analysis, and want to import all the lower level directories that were used in that analysis, you can select a .gfeat folder using the (
) you can navigate to where your feat directories are and select them. If you have done a higher level analysis, and want to import all the lower level directories that were used in that analysis, you can select a .gfeat folder using the (![]() ) button. You can also simply type in the paths to the directories in the window. You may also drag directories from the finder directly into this window. Lastly, you can click on the document icon (
) button. You can also simply type in the paths to the directories in the window. You may also drag directories from the finder directly into this window. Lastly, you can click on the document icon (![]() )and select a text file which contains a list of directories.
)and select a text file which contains a list of directories.
You must make sure that there is only one directory per line. That is, you have a carriage return separating each directory name.
You must also make sure that your provide the full path to each directory from the root level of the file system. That is, don't use ~ to stand for your home directory, and don't list paths relative to any other directory (Peate may gain the ability to process these things in the future, but for now please enter the entire path).
3) Select which EVs you want Peate to process. After you enter a feat directory, a series of buttons will appear under the window which lists your feat directories. Peate uses the first feat directory in the list to figure out how many EVs you have. Click on a button to make it dark or light. Dark numbers represent EVs which Peate will process. White numbers are EVs which Peate will ignore for all directories. For example, if you only want to look at EV 2, make sure only button 2 is selected (darkened). If no EVs are selected, Peate will process all of them.
4) Enter the mask files you are interested in. The same methods used for choosing feat directories may be used for mask files and the same rules apply. Click the choose mask button (![]() ) to choose a set of masks or the document icon (
) to choose a set of masks or the document icon (![]() ) to choose a text file which contains a list of masks. Masks may be in the standard, highres, initial_highres, or example_func space, just be sure to select the appropriate space from the pulldown menu. Peate will warp these masks into each subject's native space before extracting the timeseries within the mask. That means that you must have performed registrations on each lower level feat directory if your mask is not in the example_func space.
) to choose a text file which contains a list of masks. Masks may be in the standard, highres, initial_highres, or example_func space, just be sure to select the appropriate space from the pulldown menu. Peate will warp these masks into each subject's native space before extracting the timeseries within the mask. That means that you must have performed registrations on each lower level feat directory if your mask is not in the example_func space.
5) If you wish to extract the timecourse from a single voxel instead of a masked region, check "use coordinates instead of mask" and enter your coordinates. Voxel location should be specified in mm coordinates. Makes sure to use the dropdown menu to select which space this voxel is specified in, as peate will convert voxels to the example_func space.
6). Select options.
Window
-Specify the epoch surrounding each event that you want to look at. The times are are relative to the onset of the event. For various reasons, Peate does not take into account event durations from your stimulus files. For example, if you want to look from 10 seconds before each event onset to 30 seconds after event onset, enter 10 and 30. These times are always specified in seconds.
-Specify the kind of baseline to be used. Data output will be represented as a percent change from baseline. By default, Peate treats the average value during the window before each event as the baseline. So if you choose to look from 4 seconds before each event, the period from -4 to 0 seconds will count as the baseline. You may alternatively use the average value across an entire run as baseline, or to have the raw data output without scaling by a baseline.
Interpolation
- By default, Peate will interpolate your data to 1 second resolution. This helps if your events are not synchronized to the TR. As of version 1.65 Peate uses cubic spline interpolation by default, but you can choose to use the old-fashioned linear interpolation as well. Enter the final temporal resolution that your data should be interpolated to. Just make sure that it is evenly divisible into the TR. For exampe, if your TR is 2, your final temporal resolution cannot be .75 seconds. With spline interpolation, your data will look better at finer temporal resolutions as a smooth curve is fitted through the points. With linear interpolation a straight line is drawn from one point to the next so finer grained resolution will still look blocky.
If you choose not to interpolate, stimuli will be treated as if they start at the nearest TR.
Output
- generate plot. If this option is checked, Peate will generate a plot of your data using gnuplot. One plot is generated for each mask file, with the average across feat directories for each EV plotted. The plot will open in a drawer when finished, with a tab for each plot. You can open and close this drawer by clicking on the pointer icon (![]() ). You will also have a .gif file saved in the output directory.
). You will also have a .gif file saved in the output directory.
- find peaks. If this option is checked, the output file will also report which timepoint has the highest value for each lower level feat directory. Summary statistics show the average peak timepoint (not the peak of the average waveform). You can also choose to limit the peak search window and enter a time window within which Peate will look for peaks. For example, you may be interested in finding the timepoint with the greatest signal change within the first 5 seconds after the stimulus.
- verbose mode. This option is basically obsolete in the cocoa version of peate, but is included for debugging purposes.
Misc
- ignore blank EV files. When this option is checked, any EV files which are empty will be ignored. These will be given the value "NULL" in your output file and will not contribute to the grand mean. When this option is not checked, Peate will report an error when a blank EV file is encountered. If you are not intentionally using empty EV files, you should leave this option unchecked.
Saving and opening configurations
Once your settings are ready, you can save your configuration file by click in the save configuration button (![]() ). This will save a new .pcf file in the output folder which contains all the settings for the current analysis. You can open a saved configuration by click on the open configuration button (
). This will save a new .pcf file in the output folder which contains all the settings for the current analysis. You can open a saved configuration by click on the open configuration button (![]() ). You can also save and open configuration from the File menu, which contains a list of recent configurations.
). You can also save and open configuration from the File menu, which contains a list of recent configurations.
Running the analysis
When you are ready to go, click the Start button.
Help
First, you can get simple help by hovering your mouse over the buttons. If you have additional questions, email me at